
The USPTO’s own classification doesn’t tell you where the USPTO will send it
This was the most interesting test. CPC codes are, for all practical purposes, the fullest technical description of an application that exists. They record what the application is about, and the USPTO itself assigns them, the same Office that decides which art unit examines it. If art units were organized around technology, an application’s CPC codes should predict its art unit almost perfectly.
They don’t. I took each application’s main CPC symbol, looked up where past applications with that symbol were examined, and picked the most common art unit. That pick was right only about a third of the time. A typical main CPC symbol is examined in about 19 different art units.
Giving the lookup every CPC code on the application, not just the main one, barely helped. Even an exact match on the whole set of codes pointed to the right art unit only about a third of the time. Applications with more codes were actually harder to place.
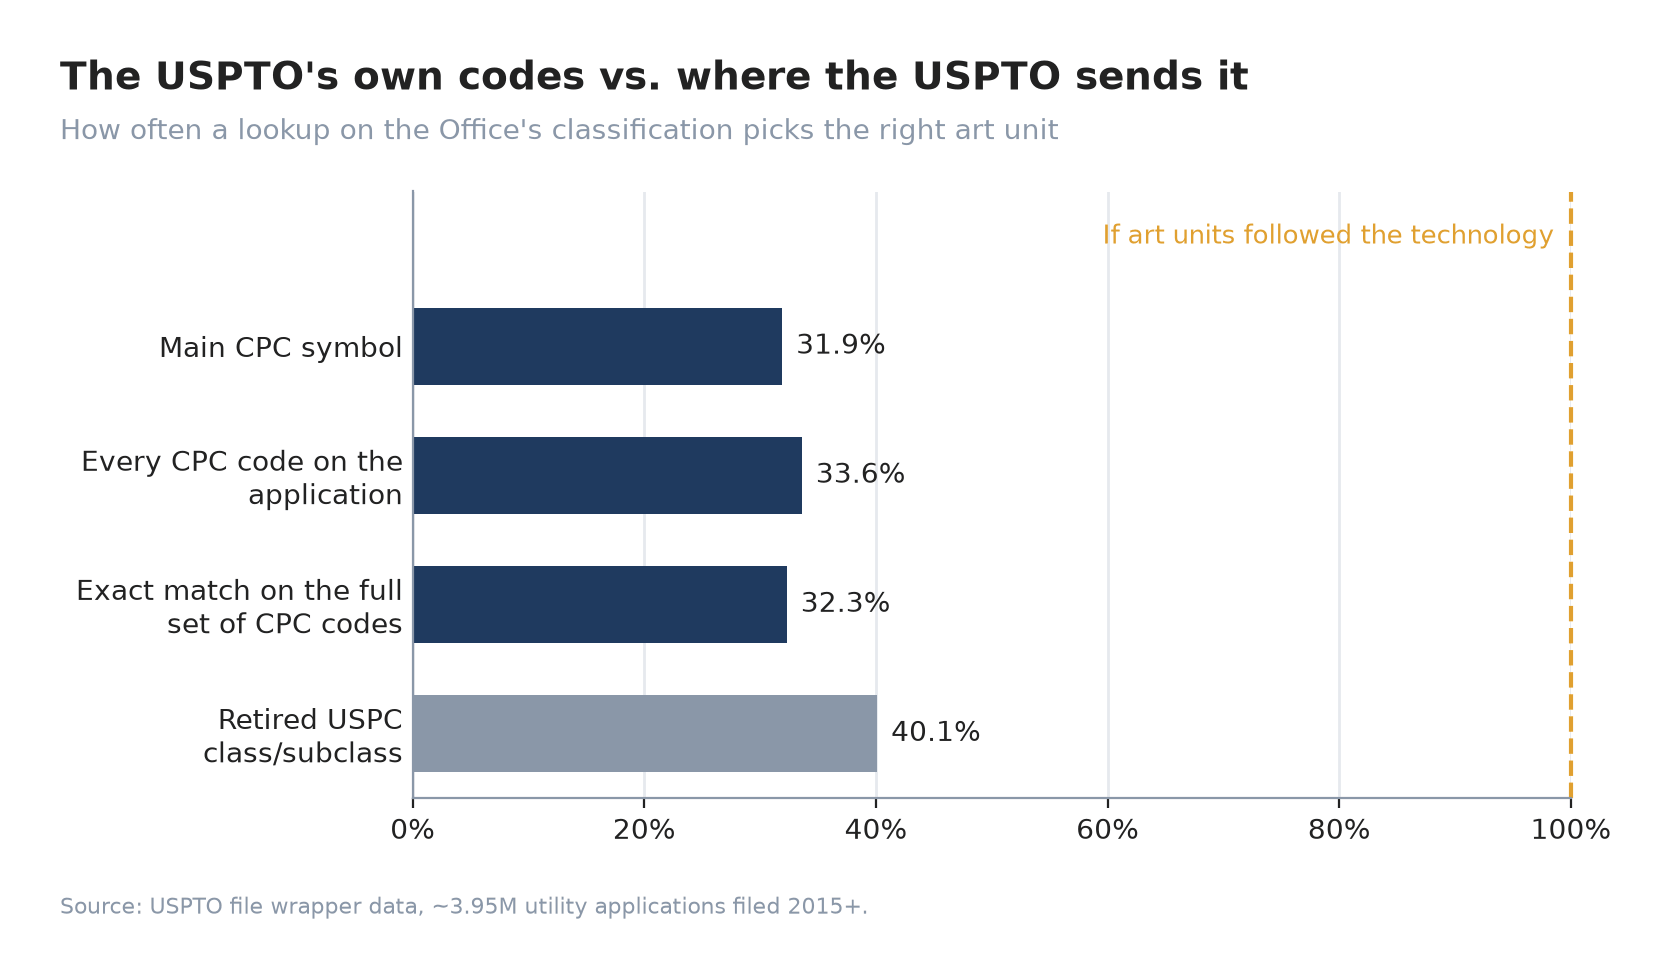
However much of the CPC classification the lookup is given, it lands on the right art unit about a third of the time. The retired USPC system does better, at 40.1%.
The retired U.S. classification system (USPC) did better, at about 40%. So the Office’s art unit map is still partly built around a classification system it officially retired years ago. Even so, a typical USPC class and subclass is spread across about 14 art units.
So the Office classifies an application one way and routes it in a way that only loosely follows that classification. Some of the reason is probably ordinary management: balancing dockets, staffing, and the history of how each art unit was carved out. But the result is a system where the Office’s own description of your invention doesn’t tell you who will examine it. That is inefficient at best. At worst, assignment depends on factors that have nothing to do with what you invented, and applicants can’t see them.
The near-twin test: a ceiling set by the Office
I also looked at unrelated applications with nearly identical claims. They had different applicants and different families, but the same technology and nearly the same words.
These near-twins land in the same art unit fewer than half the time (about 43%).
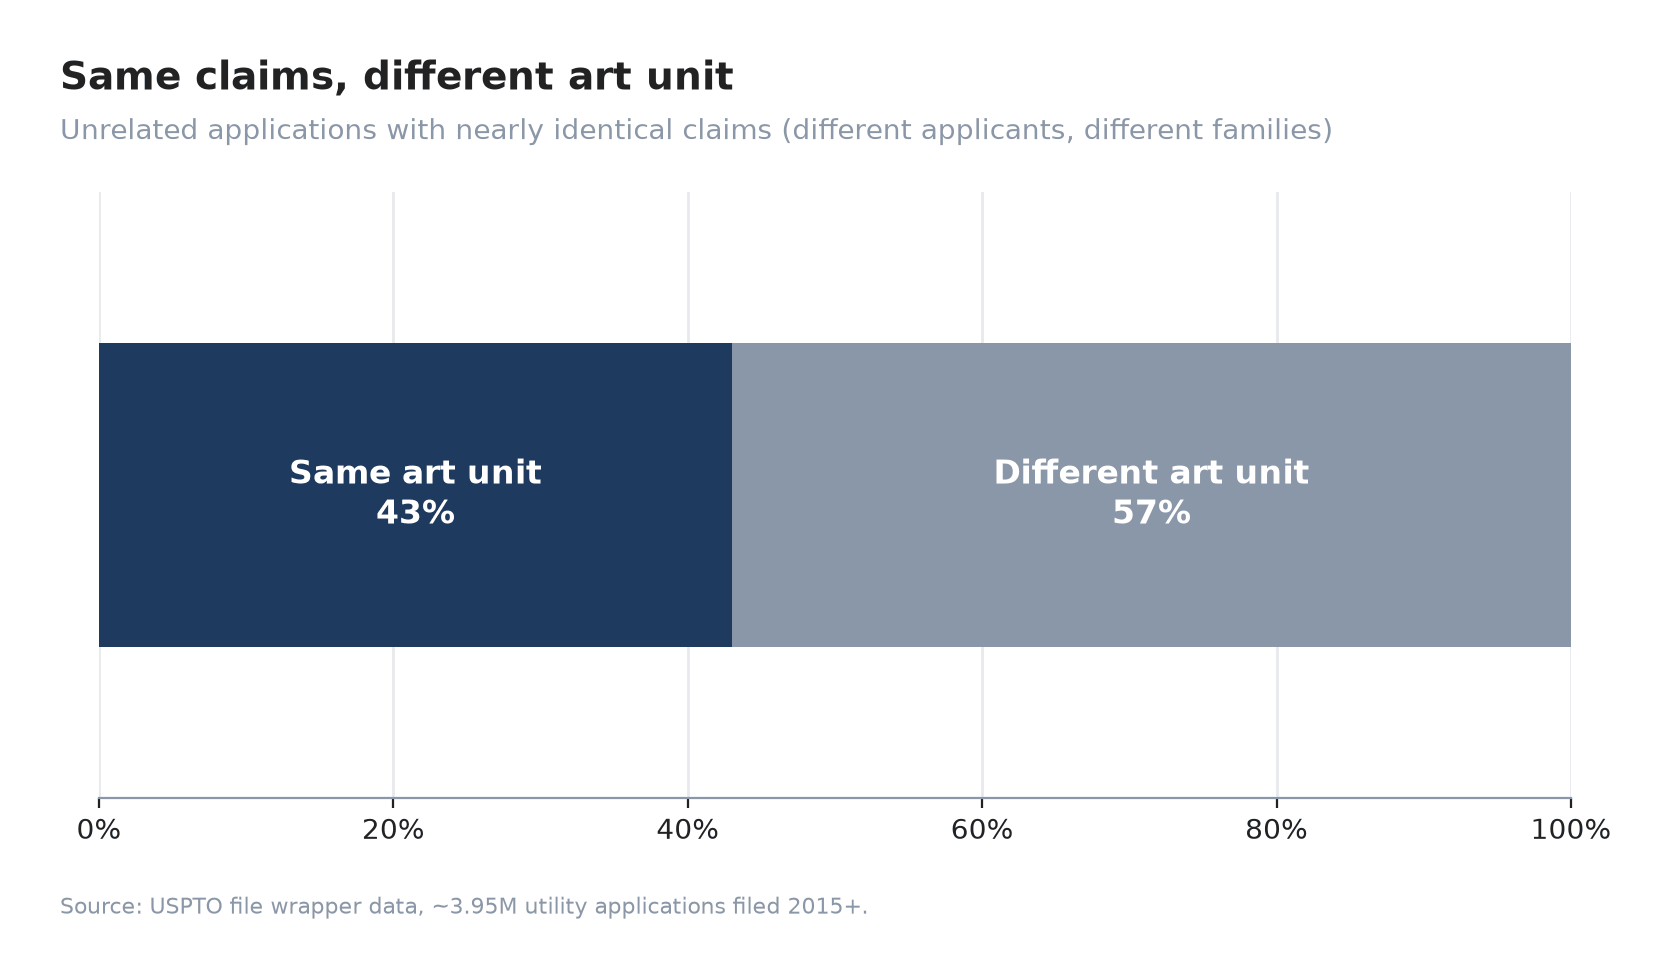
Unrelated applications with nearly the same claims. More often than not, the Office sends them to different art units.
Think about what that means for any predictor. When two applications with essentially the same claims go to two different art units, no system reading those claims can get both right. Being wrong on some of these isn’t a failure of the model. It’s built into the answer key. Part of art unit assignment simply isn’t in the application, so there is a ceiling on single-art-unit accuracy that no amount of modeling can break, and the Office sets it.
It also changes what a “miss” means. When a good predictor names an art unit and the application lands next door, the prediction often still describes where applications like yours go. The Office just sent this one somewhere else. As a builder, that tells me where to stop chasing accuracy and start reporting it more usefully.
Where assignment is close to a lottery
Next I took the most generous case. For each group, I assumed the group was already known, gave the lookup every CPC code, and checked how well it picked among the sibling art units, compared with simply betting on the busiest one.
For about a quarter of applications, mostly in TCs 2100, 2400 and 2600 (software, networking and communications), the codes barely beat that bet. Group 2470 is the clearest example. It has nine art units. Knowing the group and every CPC code, the lookup picked the right art unit about 16% of the time. Betting on the busiest art unit gets 14%.
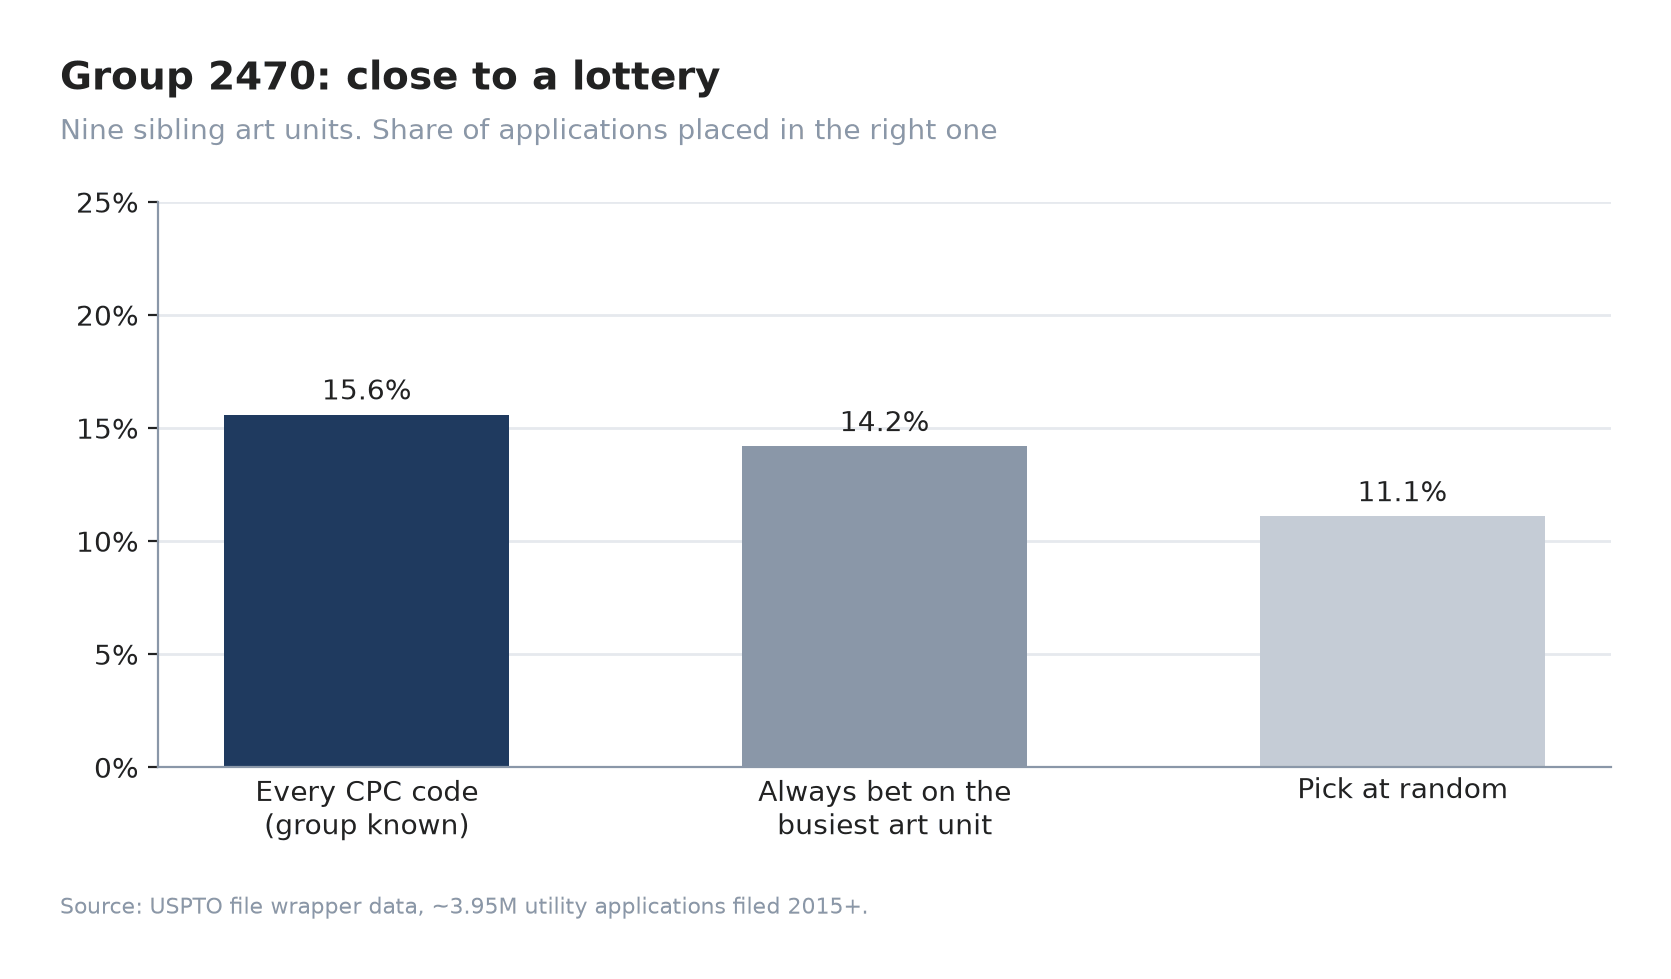
In group 2470, knowing the group and every CPC code is barely better than betting on the busiest art unit, and not far above a random pick among the nine.
Compare TC 3700 (mechanical and medical devices). There the CPC codes pick the right sibling about 80% of the time. That is what it looks like when the art unit map lines up with the technology. In much of the software art, it doesn’t.
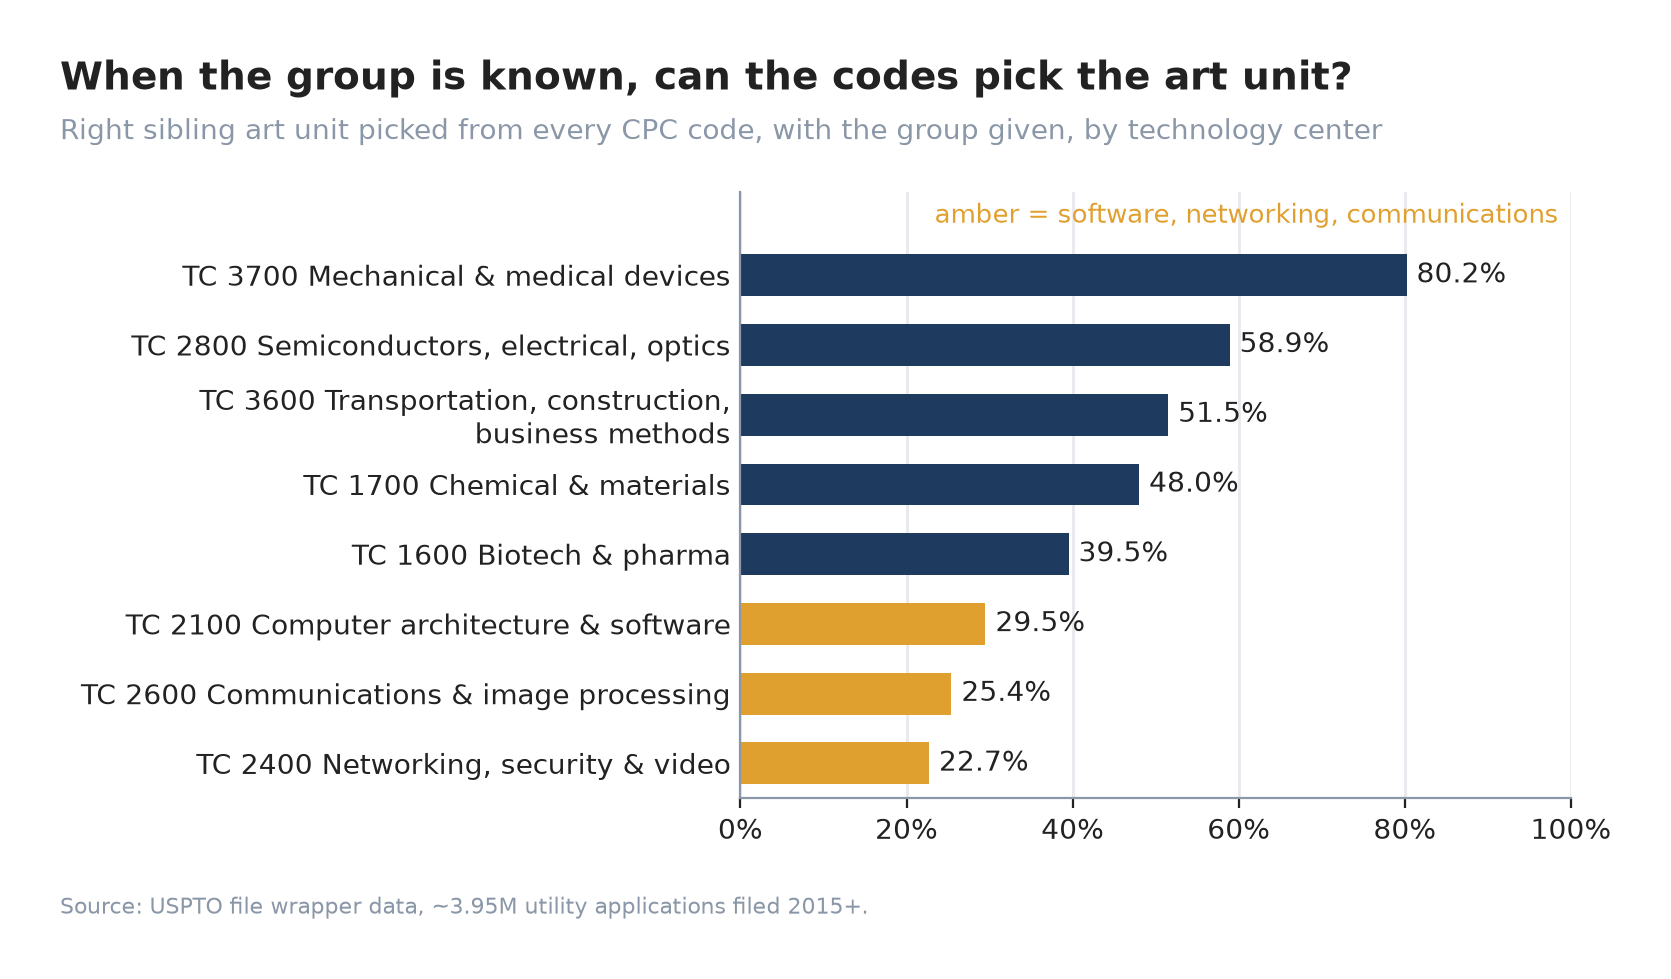
With the group already known, CPC codes pick the right sibling art unit 80.2% of the time in TC 3700, and under 30% in TCs 2100, 2600 and 2400.
My best explanation is that the Office doesn’t map art units onto the classification cleanly, and in these areas it doesn’t really try to. The Technology Center management rosters list some groups together as a single examining pool. For example, 2410/2460/2470 (multiplex and VoIP) is one pool of 27 art units. In TCs 2100, 2400 and 2600, every group the rosters list as pooled came out as a lottery in my test. Inside a pool, the art units seem to draw on the same stream of applications, so which one you land in says little about what you claimed. Our own model agrees: as described below, it can’t tell most of these art units apart either.
This isn’t a universal rule. In TC 2800, paired headings mostly describe a director’s portfolio, and most of those groups are quite predictable. Two other things probably add to it. Boundaries between siblings move as new technology matures: in most lottery groups, recent applications were a better guide than older ones. And sibling art units take in about the same volume, which fits a pool kept balanced across its dockets.
The Office’s own organization chart points the same way. The Technology Center management rosters list some groups together as a single examining pool. For example, 2410/2460/2470 (multiplex and VoIP) is one pool of 27 art units. In TCs 2100, 2400 and 2600, every group the rosters list as pooled came out as a lottery in my test. It isn’t a universal rule. In TC 2800, paired headings mostly describe a director’s portfolio, and most of those groups are quite predictable. But where the software and communications TCs pool their art units, the art units really do look interchangeable from the application’s side.
Interchangeable for routing doesn’t mean interchangeable for outcomes. In group 2610, the full set of CPC codes can’t tell you which art unit you’ll get. Depending on which one you draw, allowance runs from about 65% to 80%, and the median time to disposal from 32 to 49 months. The lottery decides more than who examines you.
Continuations: the family decides
Continuations show the same pattern from another direction. About 87.5% of child applications keep the parent’s examiner, and about 80% stay in the parent’s art unit. When a child does get a new examiner, it stays in the parent’s art unit only about one time in three, and in the parent’s group only about half the time.
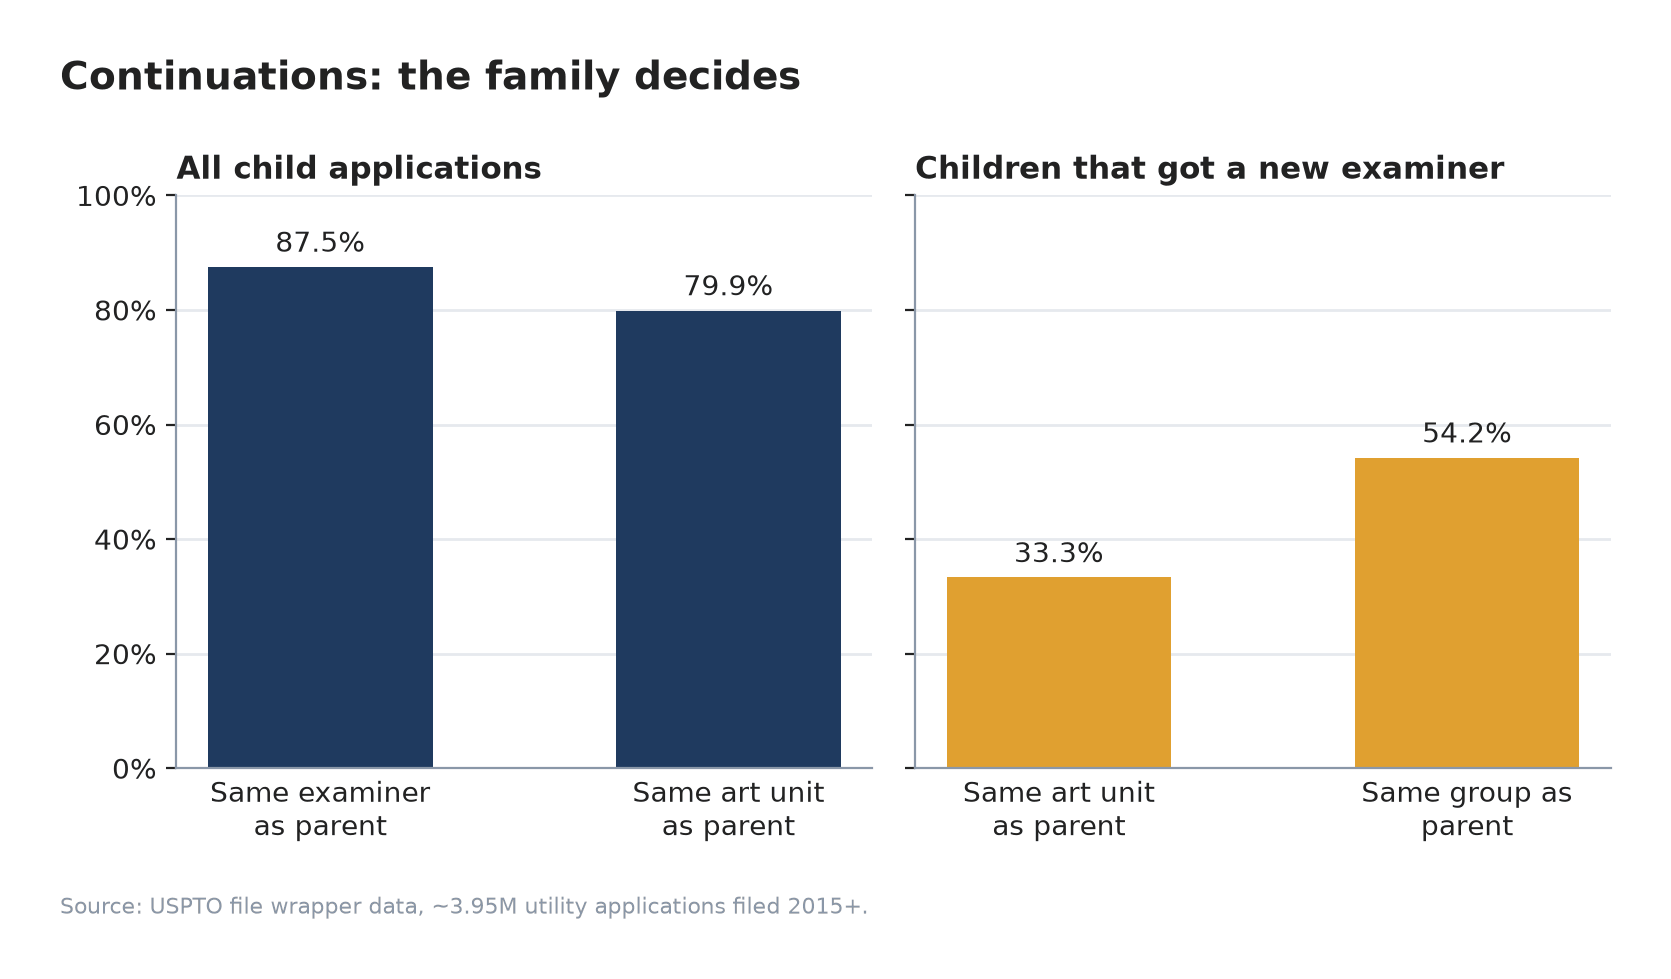
Most continuations follow the parent. Once a child gets a new examiner, the parent’s art unit is a much weaker guide.
So for a continuation, the art unit is mostly decided by the family, not the technology. Prediction adds the most value on original filings. As we’ll see below, family history is also one of the easiest ways to inflate an accuracy number.
So what is prediction good for?
Quite a lot. Everything above limits one thing: naming the exact art unit from the application alone. That isn’t the only thing a predictor does, and it isn’t the most valuable.
- The biggest differences in outcome are between groups, and those can be predicted. Across the large art units in group 3690 (business methods), allowance runs about 40–53%. In group 2470 it runs about 77–90%. Knowing which of those neighbourhoods you’re headed for matters more than which house you get.
- The group is where drafting can steer. While the claims can still change, you can draft away from a business-method group, or add technical detail before you file into a §101-heavy one.
- A ranked short list is far more reliable than a single art unit. It gives you a realistic set of outcomes to plan around.
- A good predictor tells you how far to trust it. In areas where art units follow the technology, like most of TC 3700, a specific art unit prediction is worth acting on. In the lottery-like software groups, the group or examining pool is the solid answer and the specific art unit is the most likely of several.
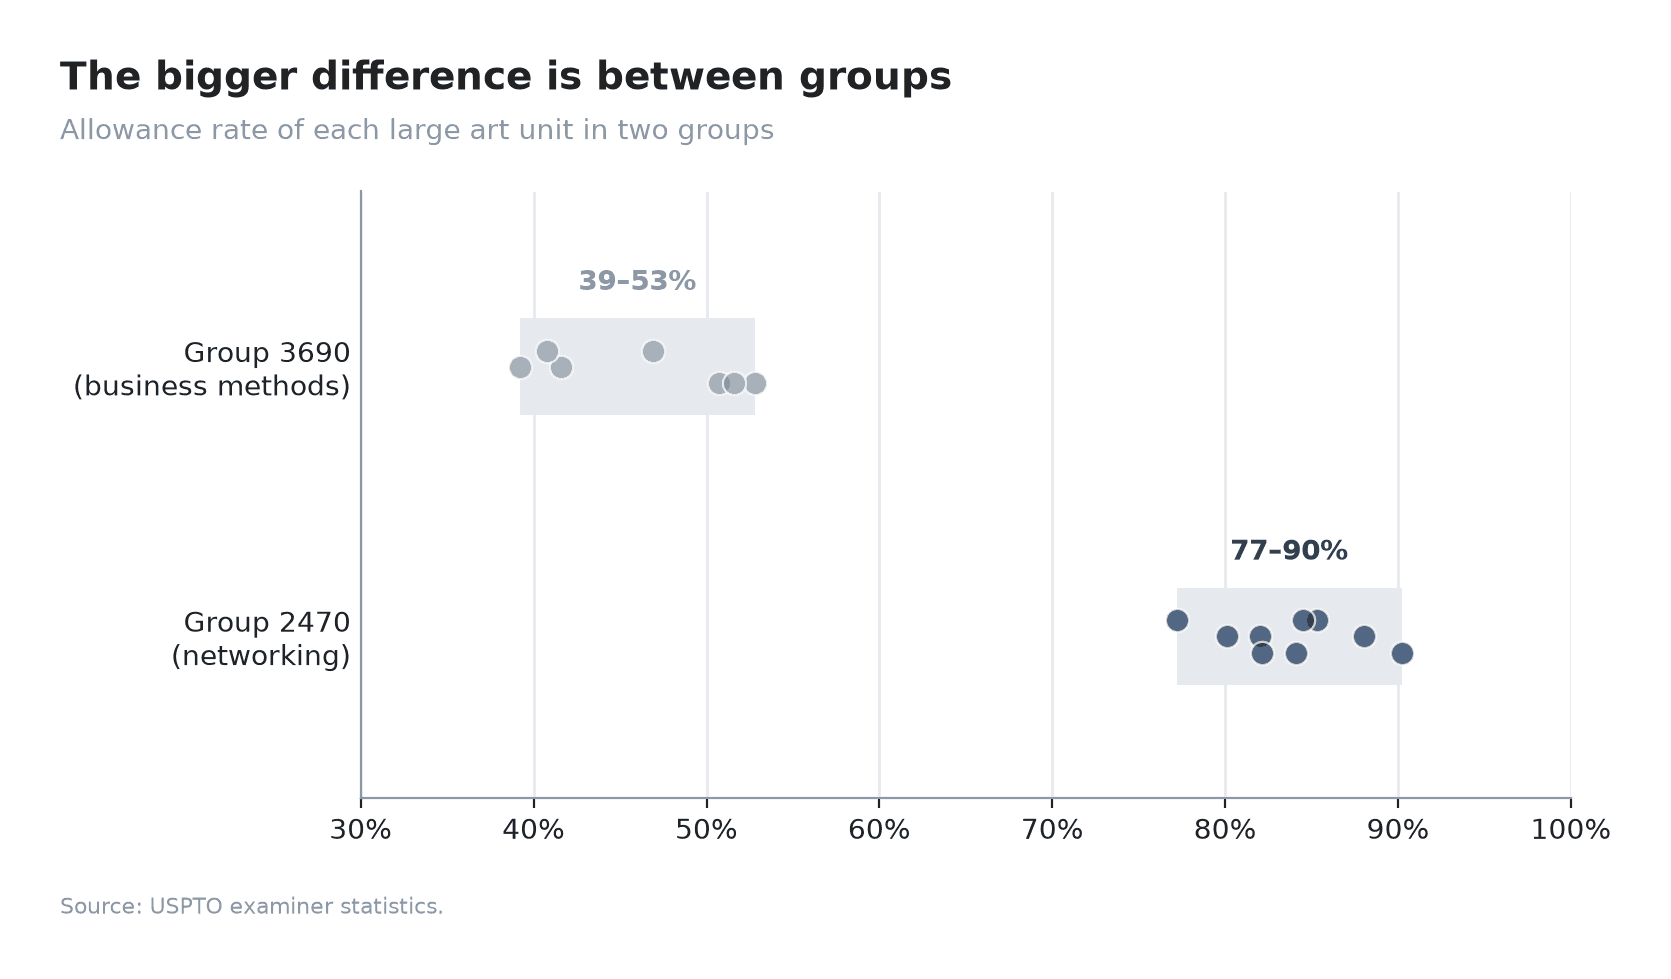
Allowance rates across the large art units in two groups. The gap between groups is far wider than the spread within either one.
When does merging art units make sense?
Given the ceiling above, you may wonder how some tools advertise art unit accuracy near 50% or higher from an application’s title and claims. One common answer is to merge art units: combine several real art units into one “unit” and score the model on the combined labels. Fewer, broader answers are easier to get right.
Merging isn’t automatically wrong. The lottery groups above are a real case for it. If the Office treats several art units as one pool, and nothing in an application tells them apart, then predicting the pool may be the best answer. So we asked two questions about our own model. When is a merge justified? And should we ship one?
First, the approach that is never justified: choosing merges with the answer key in hand. Picture a multiple-choice exam where, after grading, you rewrite the key so that “A through D” counts as correct on exactly the questions you got wrong. Your score goes up, but you haven’t learned anything. Run a model on test data, merge whichever art units it keeps confusing, then score it on that same data, and you have done the same thing. That is impermissible hindsight, applied to a model’s report card.
A defensible merge needs stricter rules. We allowed one only when three things held:
- The Office pools them. The USPTO roster puts the two art units in the same examining pool.
- The model really can’t tell them apart. On applications set aside for the purpose, the model’s choice between the two carried almost no information beyond each art unit’s share of filings.
- The score comes from fresh data. We scored the result on separate applications that played no part in choosing the merges.
The merges this produced line up with the Office’s own organization. There were 97 of them, and every one fell inside a pool the rosters had already drawn. In the multiplex and VoIP pool, 26 of the 27 art units couldn’t be told apart. On fresh applications, the model’s own split between merged art units did essentially no better than dividing the probability by each one’s share of filings. From the application’s side, these art units are predictively equivalent: one destination with several doors.
That is about as defensible as merging gets. It took 506 art units down to 409 and raised top-1 accuracy from 32.6% to 41.2%. A looser rule gave 54% over 268 “art units.” Collapsing every examining pool into one “art unit” gave 67% over 62. So merging can be done carefully, and on paper the gains are large.
We still didn’t ship it, for three reasons:
- No prediction got better. Every point of that gain came from relabeling answers, not from the model knowing more. A flat spread of probability across several art units is an honest answer, and you can see it.
- Merged units hide differences in outcome. Art units the model can’t tell apart can still prosecute very differently. A merged unit shows one allowance rate, an average across art units that may differ a lot. In group 2610, that average would hide a 15-point spread, and that spread is the thing a practitioner wants to know.
- You can have both views without merging. Our predictor ranks every active art unit separately and shows the total for each examining pool next to it. If the pool is the solid answer, the pool total gives it to you, and you can still see how the odds spread across the art units inside.
So merging can make sense as a way to read a prediction. We just don’t think it should replace the prediction. If a tool’s “art unit” covers seven real art units, a “hit” on it is closer to a group prediction, and that is worth knowing when you compare accuracy figures.
A related issue is art units that no longer exist. Our file-wrapper data since 2015 contains 554 art units in these tech centers. Checked against the current rosters, 40 of them are gone and 8 are search-and-classification units rather than examining art units, which leaves 506. A model trained on history can easily predict an art unit your application can no longer be sent to. The count also matters when you compare tools. “About 500 art units” is roughly what the Office runs today, so a figure in that range doesn’t by itself mean merging, and a figure well below it probably does.
The other thing to watch is how the test is set up. If you split applications at random into training and test sets, about a third of test applications have a relative (a parent, child, or sibling) on the training side, and a model can just copy the family’s art unit. I measured this with a simple code lookup that reads no claim text at all. Keeping families apart, it scored about 35%. Letting relatives leak across the split took the same lookup to 48%. That is more than ten points from how the test was set up, not from better prediction, and it is an easy mistake to make without noticing.
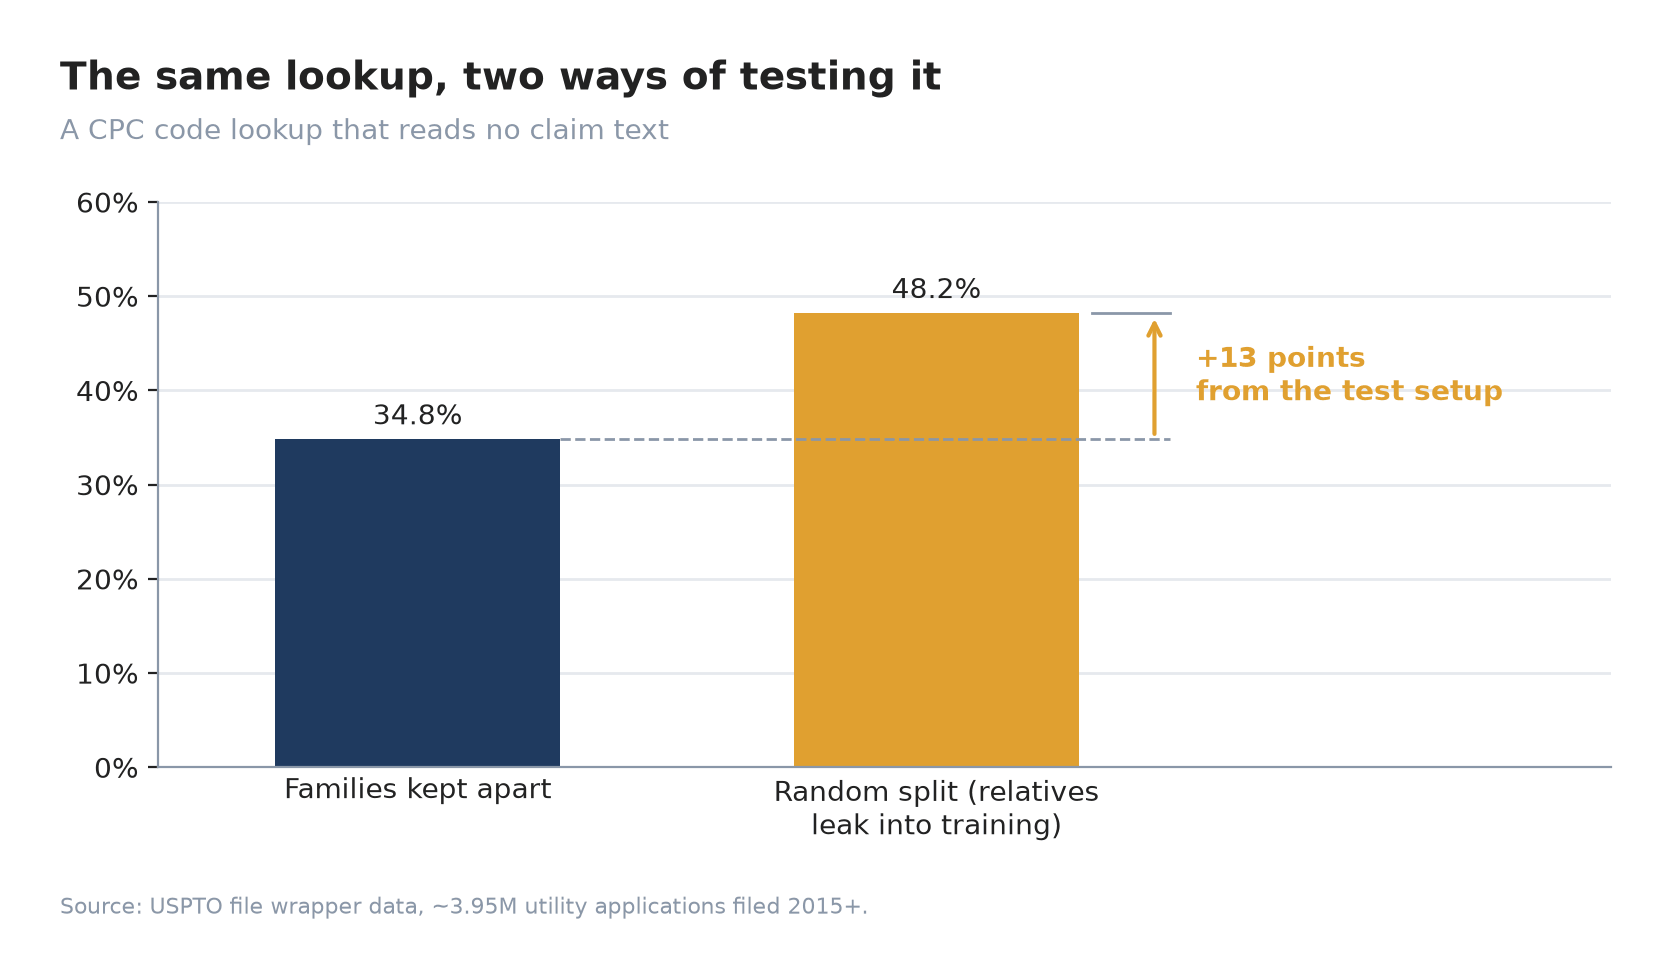
Same lookup, same data, two ways of splitting it. The 13-point difference comes entirely from letting relatives into the test set.
Neither of these makes a tool bad. But a headline number in the 50s can come from merging, from family leakage, or from both, without any better prediction. The number alone tells you little. If a vendor quotes you an accuracy figure, ask:
- How many art units does it actually choose between? Were any merged?
- If so, how were the merges chosen? Were they fixed before the model was scored, and was the score measured on applications that played no part in choosing them?
- Does it still predict art units that no longer exist?
- Were patent families kept apart, so that no test application had a relative in the training data?
- Was it tested on applications filed after the ones it learned from?
- If units are merged, can you still see each art unit’s own allowance rate, or only an average across them?
Conclusion
First, art unit prediction is useful, but it isn’t magic. It can’t fully see past the USPTO’s own opacity, because even the Office’s classification of your application doesn’t decide where the Office sends it. What it can do is predict the group, examining pool and technology center where outcomes differ most, give you a ranked short list of likely art units, and tell you when a specific art unit prediction is strong enough to act on.
Second, single-art-unit accuracy has a hard ceiling, and the Office sets it. When near-identical applications land in different art units, no model can get them all right. I went looking for that ceiling so I could build the best tool the data allows. That also makes inflated numbers easy to spot.
The updated predictor is now live in N-Spec. It predicts only art units on the current USPTO rosters and ranks each one separately, with no merging. It shows totals by examining pool, group and tech center, and gives prosecution statistics for each art unit rather than a blended figure. I’ll share how it performs, and exactly how I measured it, in a follow-up article.
About the data: USPTO bulk file wrapper and pre-grant publication data for utility applications filed January 2015 or later in Technology Centers 1600–3700, about 3.95 million applications. Art units are as currently listed in the file wrapper. Active art units and examining pools come from the USPTO Technology Center management rosters. The sibling and lottery results group art units by number (for example, 2471–2479 as group 2470); the rosters place a few art units in different groups. Allowance rates come from USPTO examiner statistics.